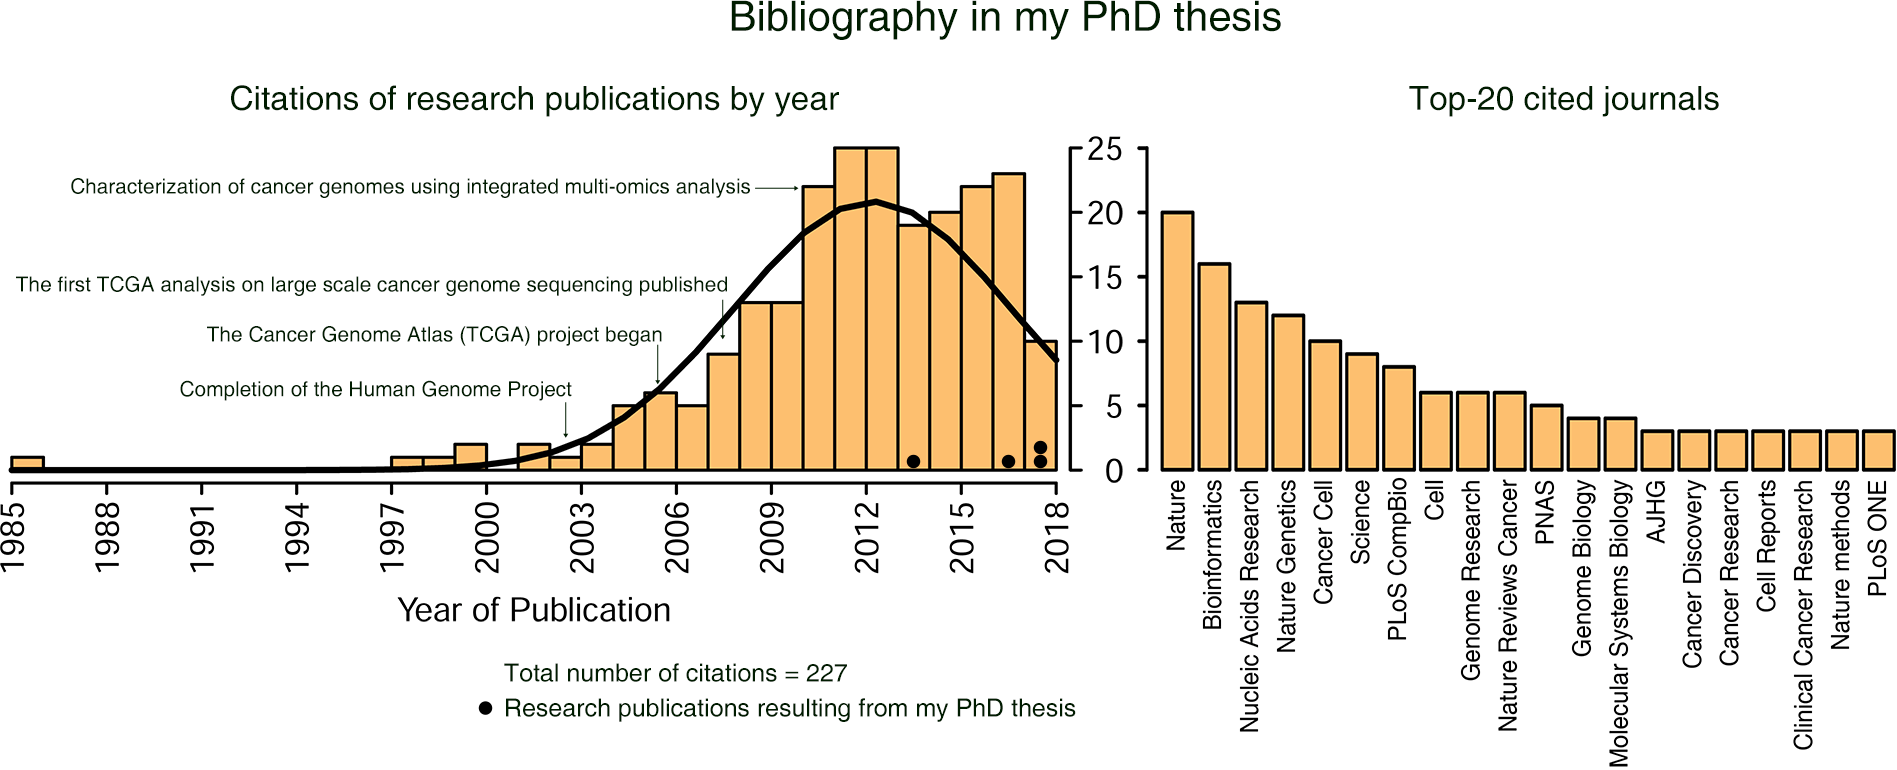
I defended my PhD in Bioinformatics from the University of British Columbia (UBC) on August 2018. My PhD thesis can be accessed from the UBC Library Collections. Here, I attempted to visualize bibliography in my PhD thesis. Hope you will find this interesting and useful.
Download the bibliography (.bib) file
Define Libraries
library("RefManageR")
library("dplyr")
Read .bib file
file.bib <- file.path("raunak_shrestha_ubc_phd_thesis_bibliography_2018.bib")
bib <- suppressMessages(RefManageR::ReadBib(file.bib))
Convert bib object to dataframe
dat <- as.data.frame(bib, row.names=NULL, optional=FALSE)
val.year <- as.numeric(dat$year)
Generate histogram of citations by year of publication
    h <- hist(val.year, breaks=30, plot=FALSE)
    xfit <- seq(min(val.year), max(val.year), length=30)
    yfit <- dnorm(xfit, mean=mean(val.year), sd=sd(val.year))
    yfit <- yfit*diff(h$mids[1:2])*length(val.year)
    plot(h, col=c("#fdbf6f"), main="", xlab="Year of Publication", ylab="No. of Citations", axes=FALSE,
            cex.main=1, cex.lab=1, cex.axis=1, las=1, tck=-0.03)
    lines(xfit, yfit, col="#000000", lwd=3)
    axis(side=1, at=seq(1985,2020,3), labels=TRUE, tick=TRUE, cex.axis=1, las=2, lwd=1, tck=-0.03)
    axis(side=2, at=seq(0,25,5), labels=TRUE, tick=TRUE, cex.axis=1, las=1, lwd=1, tck=-0.03)
Distribution of citations by the journal of publication
For the sake of visualization, we will restrict to top-20 journalsdat1 <- dat[-which(is.na(dat$journal)),]
df <- dat1 %>% dplyr::count(journal, sort=TRUE)
df20 <- df[1:20,]
df20
## # A tibble: 20 x 2
##    journal                        n
##    <chr>                      <int>
##  1 Nature                        20
##  2 Bioinformatics                16
##  3 Nucleic Acids Research        13
##  4 Nature Genetics               12
##  5 Cancer Cell                   10
##  6 Science                        9
##  7 PLoS Computational Biology     8
##  8 Cell                           6
##  9 Genome Research                6
## 10 Nature Reviews Cancer          6
## 11 PNAS                           5
## 12 Genome Biology                 4
## 13 Molecular Systems Biology      4
## 14 AJHG                           3
## 15 Cancer Discovery               3
## 16 Cancer Research                3
## 17 Cell Reports                   3
## 18 Clinical Cancer Research       3
## 19 Nature methods                 3
## 20 PLoS ONE                       3
par(mar=c(4,12,2,2))
barplot(rev(df20$n), width=1, names.arg=rev(df20$journal),
horiz=TRUE, col="#fdbf6f", las=1,
main="", ylab="", xlab="No. of Citations",
cex.axis=1, cex.names=1, cex.lab=1, tck=-0.03)